Project Overview
- Data Extraction: Headlines were extracted from the NYT API, ensuring we had a comprehensive dataset to work with.
- Data Transformation: Using Python scripts, we cleaned and transformed the data to focus on the most relevant information. This involved removing stop words, and other unnecessary data to standardize the words.
- Data Loading: Transformed data was stored in a DuckDB for efficient querying and analysis.
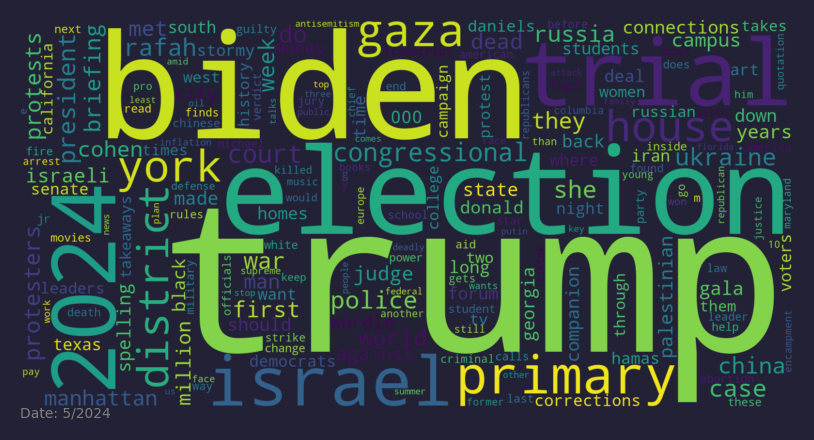
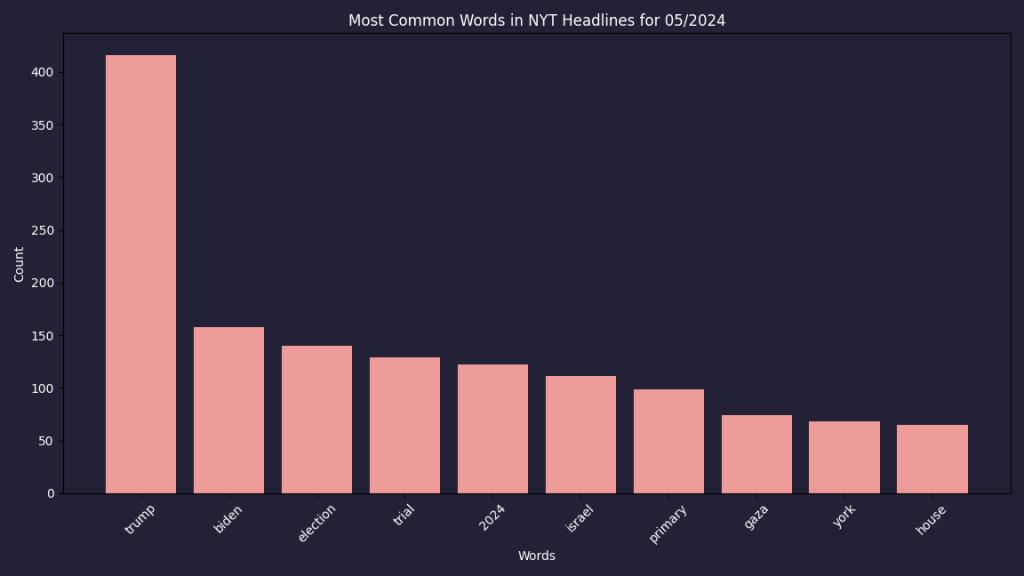
- Visualization: I created word clouds and bar charts to visualize the most common words in the NYT headlines.
Visualizations
- Word Cloud: The word cloud shows a visual representation of the most common words in the headlines, with larger words appearing more frequently.

- Bar Chart: The bar chart provides a quantitative view of the word frequencies, showing the most common words in descending order.

Technology Stack
- Python: For data extraction, transformation, and analysis.
- Matplotlib & WordCloud: For creating visualizations.
I’m going to expand it, at the moment it’s analyzing data from the previous month, but I’m going to build the entire application around it.
You can see the entire project and source files on my github.